
This post shows at a high level the stages in processing the data captured during an imaging session all the way through to the final image, in this case the image of the Iris and Ghost nebulas that I captured at Oregon Star Party this year. The picture above is a screen capture taken on my control PC just after the first luminance frame had been captured, and you can see the resulting raw image at the right of the screen. In the remainder of this post, I will follow this image all the way through the processing workflow, which typically takes me several hours.
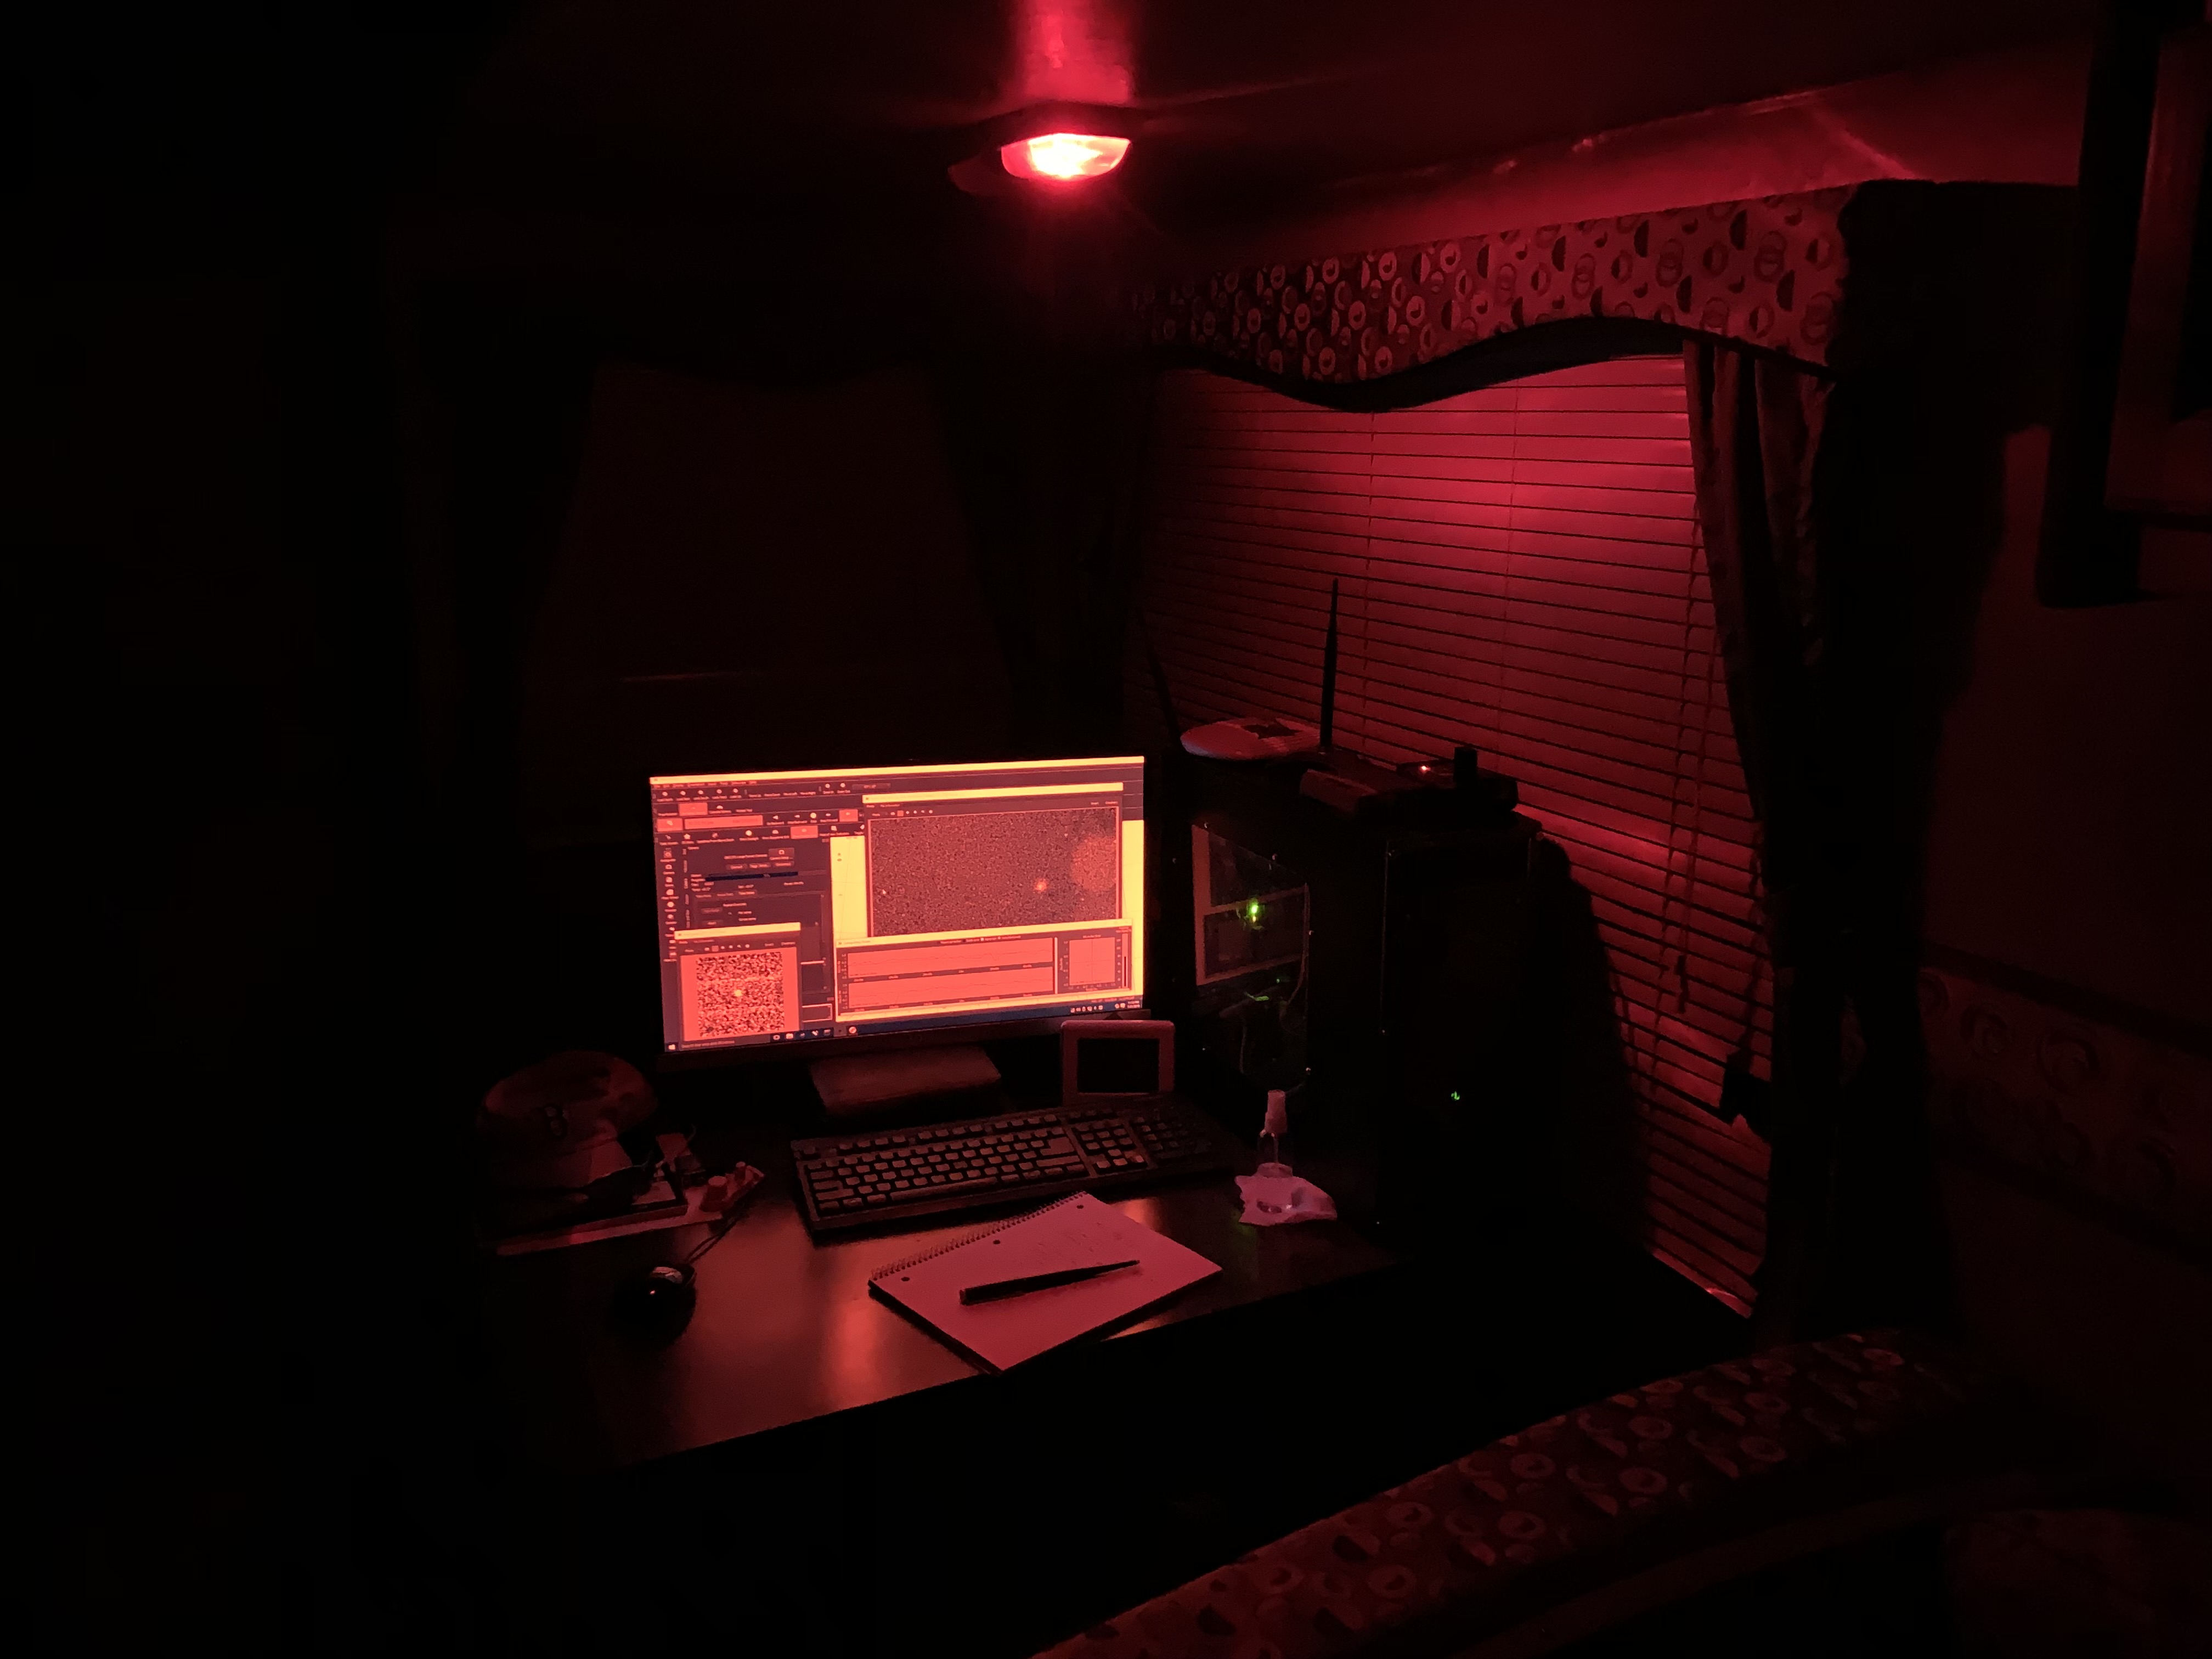
The red image is because I’m using a specially adapted monitor that can be switched to only show red light at night time. At a dark location like OSP, I’m in the presence of several hundred other astronomers, many doing visual observing and extremely sensitive to anything that might compromise their eyes’ dark adaptation. In this situation, I have to go to extreme lengths to limit any light that I might be generating; lights not only have to be red, they have to be extremely dim, even those inside my travel trailer. This is what it looks like inside the trailer with my desktop control PC, although the picture doesn’t really convey just how dim everything is. The monitor’s brightness is turned all the way down to the minimum, and during the daytime it’s a challenge to tell if it’s even switched on when in this state. The light fixture above is the only one switched on in the trailer, and is fitted with one of these: a single red LED bulb with an output of 2 lumens. For comparison, a 60 Watt incandescent bulb has an output of 800 lumens. I have to apply multiple layers of duct tape over any indicator LEDs around the trailer; the one on the fridge needs 3 layers to adequately blot out the stray light. The green light just to the right of the monitor in the picture is the back side of the indicator LED on the Ethernet port escaping through the window on the PC’s case. Most of the light goes the other way and is well-covered by duct tape. I need to remember to take that thing out and paint over it before next year.
As for the captured image, there’s not much to see at all; everything is very distorted, and there are a lot of bright lines overlaid on everything. The reason for this is just that the light entering the camera is at such a low level that, even with a 10 minute exposure, the captured signal is still very dim in comparison to, among other things, defects in the camera that will have to be removed later. In this particular case, even in the very brightest parts of the image, the number of photons hitting each pixel is only about 50 to 100 per second. In the fainter, dusty parts of the nebula being imaged, that drops to the range or 1 or 2 photons per second. At these light levels, minor defects in the image sensor, present in any digital camera, that would normally be swamped by the illumination and not visible are still very significant.
In order to be able to see anything, the image has to be “stretched”, which can be thought of as turning up the brightness of the image. Carefully applying the stretch in exactly the right way is critical to producing a good quality image, but this is typically performed very late in the process. In the meantime, in order to see anything, it is necessary to apply a temporary “screen stretch” that does not modify the underlying image, but just changes how it is shown on the screen. The image capture software that I’m using, TheSkyX Pro, applies a fast-to-compute but extremely crude screen stretch that tends to accentuate defects in the image and doesn’t really show much image detail at all.
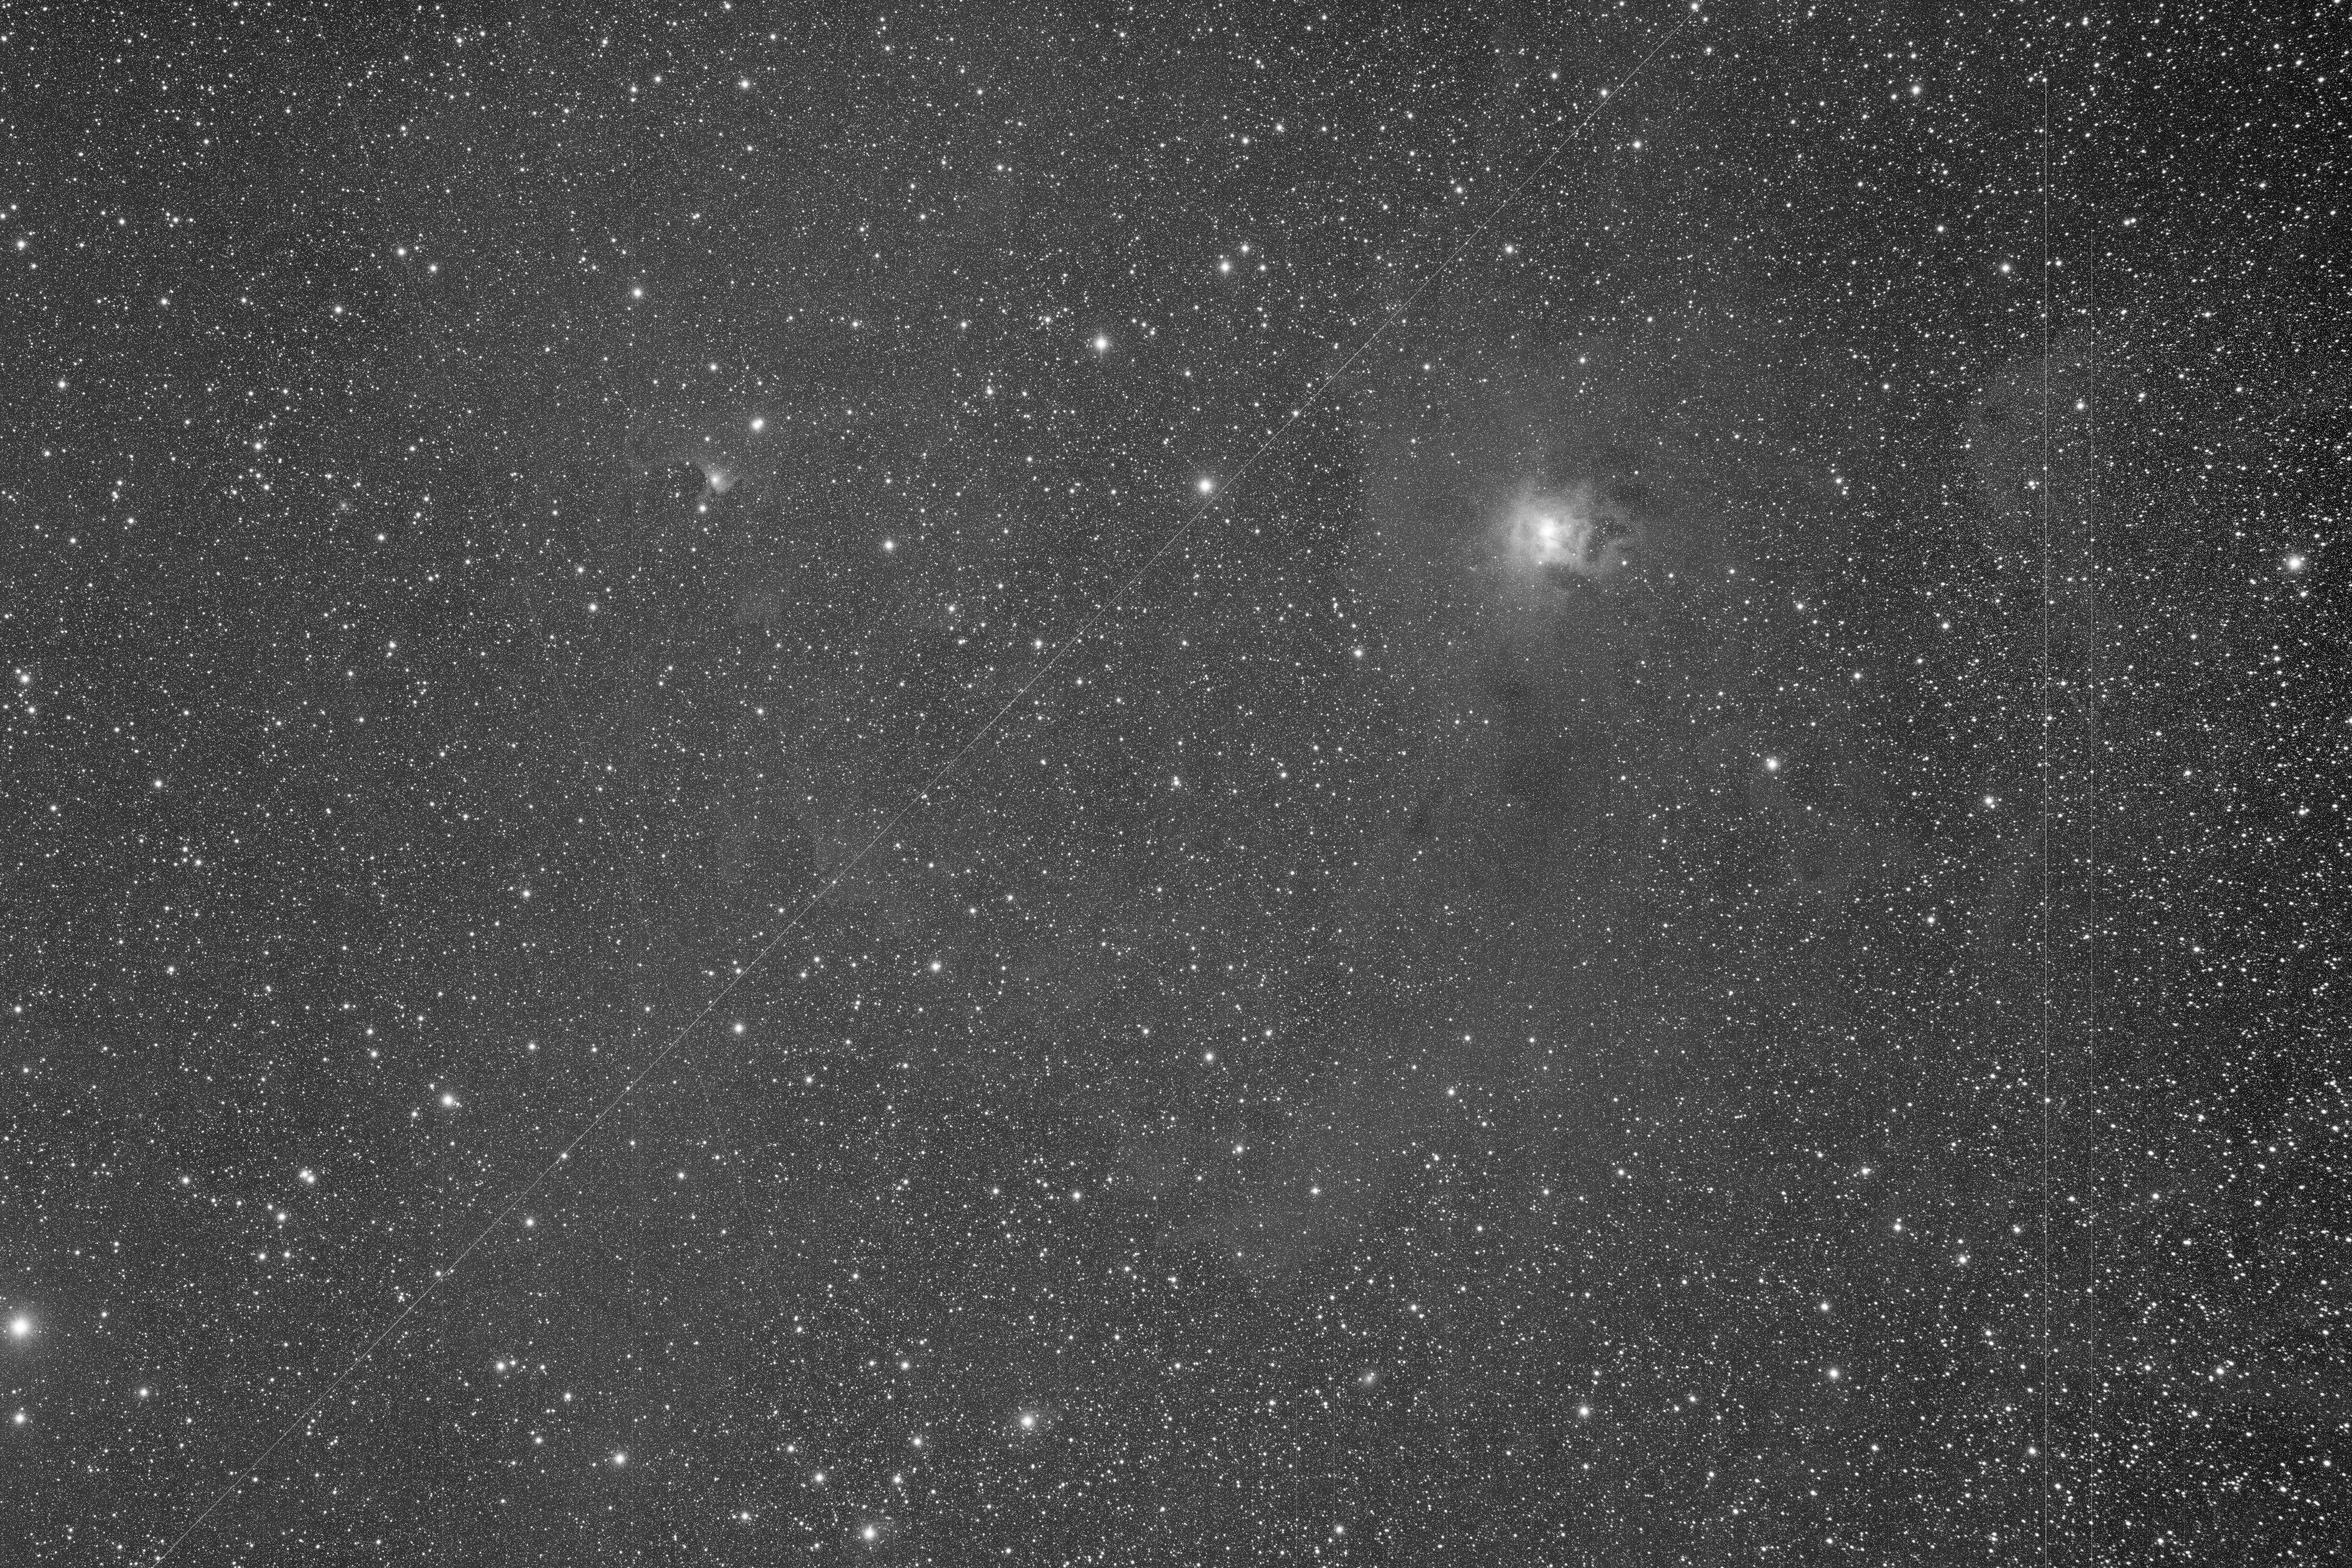
Once the image capture process is complete, processing during the daytime can begin, in this case using Pleiades Astrophoto PixInsight. The picture above is the same raw, unprocessed image as shown at the top of the post, but viewed in PixInsight and using the much more sophisticated Screen Transfer Function as a screen stretch. Looking at the full size image (click to enlarge) there are all kinds of defects immediately apparent:
- There are numerous bad columns visible, showing as bright vertical lines starting at the bottom of the image
- There are a very large number of bright single pixels throughout the image, known as hot pixels. These are not stars, but defects in the camera chip
- Uneven illumination. Among other things, the image is brighter in the center than at the corners (not very obvious in this image, but trust me, it’s there)
- There are at least two fairly prominent diagonal lines in the image. The fainter one is probably a satellite, and the brighter one (that looks almost like a dashed line) is probably a discarded upper stage rocket booster, tumbling as it orbits and blinking in the reflecting sunlight
- The whole image is very noisy and the nebula itself is very dim and low contrast
The first step is to calibrate the image, which will take care of the first three of these points.
The first two are caused by defects in the camera, which are quite consistent from one frame to the next, and so can be characterized and subtracted. This is done by using two sets of calibration frames, known as bias frames and dark frames. A bias frame is a zero-duration exposure taken with the shutter closed, and captures the ground-state of the camera. A dark frame is a long exposure, also with the shutter closed, and captures any internal “leakage” in the camera chip. This leakage is the source of much of the hot pixels and bad columns. To adequately characterize the camera, is is necessary to take a large number of bias and dark frames (I used 50 bias and 20 dark frames), and then average them to create a master bias frame and master dark frame respectively.
The second is caused by a combination of the optics (any optical system will exhibit some level of uneven illumination), dust on the optics, filters, or camera, and also a variation in the sensitivity of the individual pixels within the camera. To correct for all of these effects requires a set of flat frames. A flat frame is an image taken of some evenly illuminated light source, which could take many forms. For my flat frames, I use a flat box, which created the required even source artificially. As for the bias and dark frames, it is necessary to take a large number of flat frames for each filter, and then average the sets to create a set of master flat frames. I used 30 flat frames for each of the luminance, red, green and blue filters.
I’ll skip over details of the calibration process itself here (for more details, see here and here). Following calibration using the master bias, dark and flat frames, the single image now looks like this:

What can be seen here is that the first three things on the bullet point list from above have now been fixed. It really helps to open both of these images in separate tabs so that you can flip back and forth between them, and show them at full scale, to see the differences. It should be quite apparent that the bad columns have gone, along with the “salt and pepper” overlay from the hot pixels.
If you look at the images scaled to fit the browser window and flip between them, it should also be more apparent that the uneven illumination has been fixed as well, with the image more obviously flat from one corner to the other.
What is left, though, is that the image still contains tracks from satellites (and rocket boosters) and is still very dim and noisy. If you look at the dusty tail of the Iris nebula, in the lower right of the image, the noise (which might be described as “graininess”) is particularly apparent. This is another effect of the very low light levels; although there are various noise reduction tools that can be used to smooth this out, they are at best band-aids, and the only real fix is to collect more light. This requires more exposure time, and in this case takes the form of many images (15 exposures of 10 minutes each, similar to this one) that must be combined to synthesize a single image of very long exposure duration.
This process will also, along the way, facilitate eliminating the satellite tracks. The “Integration” tool in PixInsight that combines the images also supports various statistical outlier rejection methods that take care of this. Since each specific satellite track only appears in one of the 15 source images, the algorithm can see that those pixels do not fall in the same brightness range as the corresponding pixels in the other images, and exclude them from the combination.
Following the integration step, the now combined, 2 1/2 hour exposure looks like this:

Comparing to the previous image, it should be apparent that the tracks have gone, but more importantly, the noise has greatly decreased, particularly in the dimmer, dusty parts of the image.
The next step is to sharpen the image using deconvolution. The stars in the image started as point sources of light, and the image of each star in the image represents the blurring of such a point source by the atmosphere and optics. By combining the images of a large number of stars in the image, we can create a model of this blurring. The deconvolution algorithm uses this model of the blurring as an input, then applies an iterative process to reverse some of the effects. The mechanics of actually applying deconvolution using the tool in PixInsight will require a post to itself to explain, but the results of 20 iterations are below. The effect is quite subtle, but note that the stars are tighter and more detail is visible in the brighter parts of the nebula.

So far in all of these steps, we have been working with a linear or non-stretched image. All of the processes described above require a linear image, and the pictures shown include a temporary screen-stretch so that we can see what we are doing. At this point, we now need to apply a permanent nonlinear stretch.
There are multiple different methods included in PixInsight for doing a nonlinear stretch, and selecting the best method (or methods – there may be multiple steps involved) and tuning the parameters will have a significant impact on the quality of the final image. Going over these various methods will take another post by itself, but for now I’ll just briefly explain the two steps that I used:
- The first step I used is PixInsights Masked Stretch tool. This PixInsight-specific tool can produce excellent results, particularly on nebulas, and generally provides for good contrast without causing the stars to bloat significantly. However, it does not produce good results on all images and requires trial and error to see how well it will do
- The second step I used is PixInsight’s Curves tool. This is a general nonlinear stretch method that is implemented in virtually every astro-imaging processing system, although details vary. This can be used to enhance contrast in specific brightness ranges that correspond to interesting parts of the image. In this case, I applied a curves adjustment to increase the contrast of the brightness range corresponding to the core of the Iris nebula.
The results of all of this are below; this is the final monochrome image before we move to the RGB combining step.

Finally, we need to reintroduce the RGB data. So far, all of the images I have shown are from the set captured using the luminance filter. This is the channel that I spend most of the time on, both in terms of exposure time and processing time. The red, green and blue filtered data is typically captured using shorter exposure durations and using 2×2 binning, and is processed separately. The final step of processing is to combine the RGB image and the luminance image that has been shown. The luminance and RGB data was previously aligned prior to the integration step, and so can be directly combined using PixInsight’s LRGB combination tool. The resulting final image is shown below.

My workflow is constantly evolving; although I have a very functional workflow that produces great results, PixInsight contains such a vast array of tools that I have barely scratched the surface of its capabilities even after several years of using it. I am always exploring additional tools and methods that I will add in to my workflow as I get a good understanding of them.
I’ve only been able to cover the very high level overview of the processing steps that I use in this post. That whole process takes about 3 to 5 hours, and there are many of the finer details of each step that I have skipped over and will need return to cover in separate posts (including most of the RGB branch of the process).